


Every application/API service generates logs that need to be monitored and analyzed for analytics purposes. Out of all the monitoring techniques, ELK (ElasticSearch, Logstash, and Kibana) is one of the best for monitoring, logging, and log analysis.
Let’s start with the setup and installation.
Installation:
- ElasticSearch :
Windows users can download the installer zip from here: Link. While macOS users can install it via Homebrew.
- To install with Homebrew, you first need to tap the Elastic Homebrew repository:
brew tap elastic/tap
- Once you’ve tapped the Elastic Homebrew repo, you can use the below command to install the latest version of Elasticsearch.
brew install elastic/tap/elasticsearch-full
- Once it’s done, run elasticsearch from anywhere:
elasticsearch
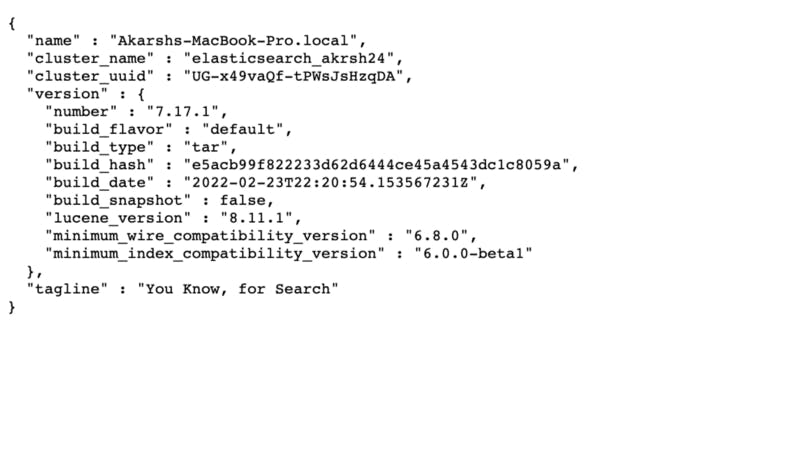
- This will run elasticsearch on http://localhost:9200/, with content something like this.
2. Kibana :
Windows users can download Kibana from here: Link. While macOS can do it via Homebrew.
- Install the latest version of Kibana by running:
brew install elastic/tap/kibana-full
- Once it’s done, run kibana from anywhere:
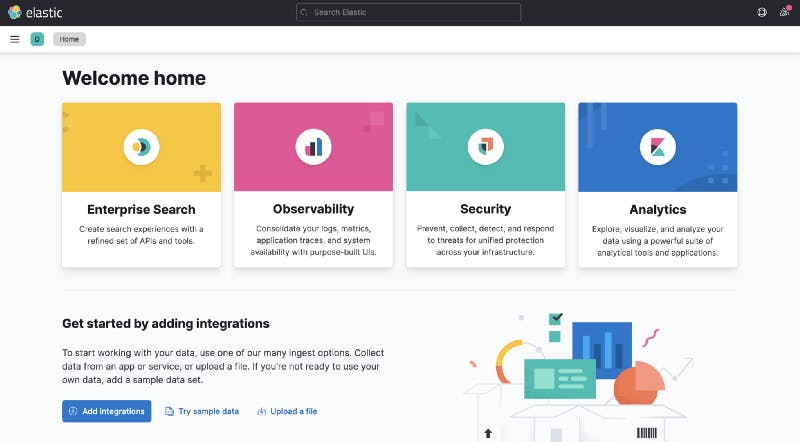
- This will run kibana on http://localhost:5601/, with content something like this.
3. Logstash :
Download Logstash from here: Link.
- Once the download completes, unzip the download file and move inside the folder.
cd logstash-8.1.1/
Logstash configuration file
To configure Logstash, you need to create a config file that specifies which plugins you want to use and the settings for each plugin. You can learn more about how we make it, and the different plugins and filters we can use to parse required data from the logs here: Link. Here is a simple example of a logstash config file, where we are using the “grok” filter to get different elements from each log generated.
For reference purposes, our log file contains logs in this format.
Log format: Timestamp — Function-name — Level — Message
2022-03-11 22:29:01,864 - app-logger - INFO - Get data1

2022-03-12 22:30:01,864 - app-logger - INFO - Get data2

2022-03-13 22:31:01,864 - app-logger - INFO - Get data3

2022-03-14 22:32:01,864 - app-logger - INFO - Get data4

2022-03-15 22:33:01,864 - app-logger - INFO - Get data5

2022-03-16 22:34:01,864 - app-logger - INFO - Get data6
- The configuration file will look something like this:
Logstash configuration file
Grok is a great way to parse unstructured log data into something structured and queryable. Learn more about grok filter, here.
Here, we have made each element of a log queryable.
Now, run logstash by copying this config file inside /conf/.
bin/logstash -f conf/logstash.conf
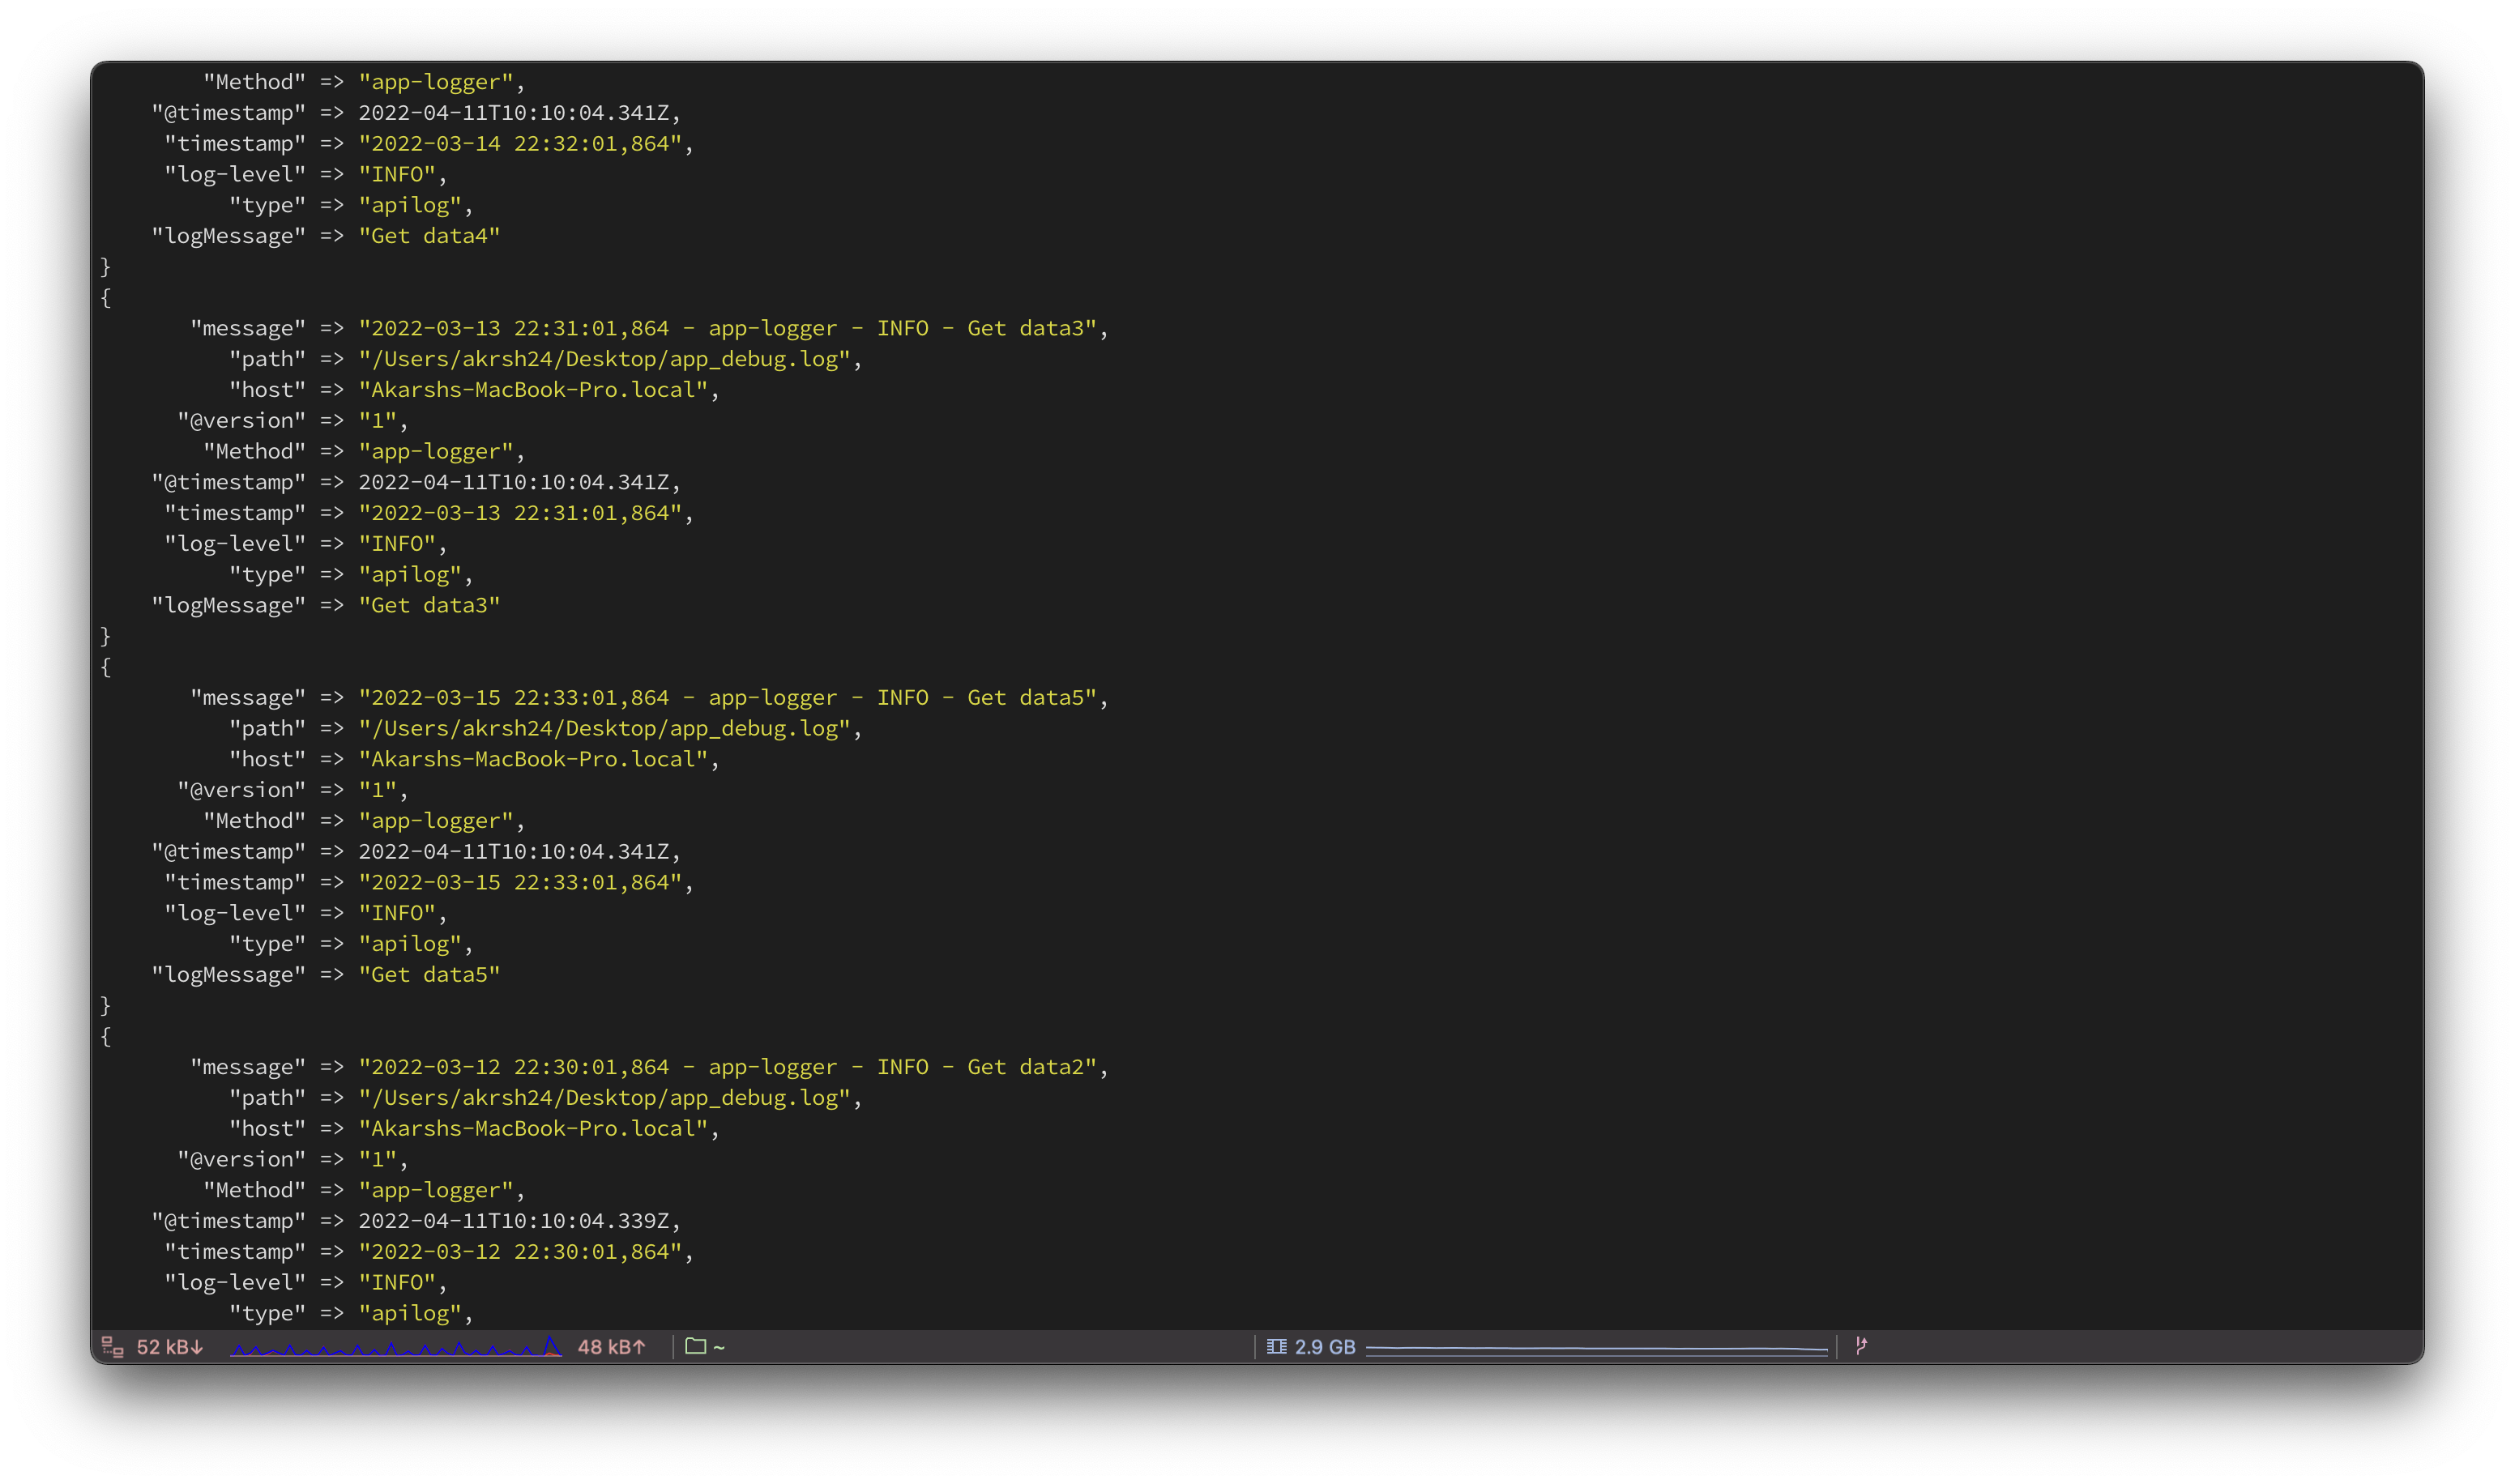
- Logstash will start and start generating logs like this. Each of the keys you see is queryable. (timestamp, log-level, logMessage, type).
So, we have successfully installed and set up an ELK pipeline. You can view logs on the Kibana level by :
Create an index pattern by going through http://localhost:5601/app/management/kibana/indexPatterns.
Click on the “Create Index Pattern” button on the top right side of the screen and add a new index pattern that matches the index you have mentioned in the logstash config file.
After creating, switch to http://localhost:5601/app/discover and select the created index pattern. You will start seeing all the logs now.
You can create a dashboard with different visualizations like table, area, and other graphs.
That’s it from the setup and installation part of the ELK stack. In the next part of this article, we will cover setting up a pipeline to ingest GKE logs into the ELK stack.
If you find this article interesting and helpful, do give some claps, and please share it with your friends. Stay tuned for the next part.
References: